The Decision Risk of Tool Fragmentation: One Calculation, Three Tools, Answers 8.7% Apart
The same estimation formula runs in three of our tools. On one work item the answers diverged by 8.7% — not from a bug, but from rounding mode — and a second, larger divergence needed no rounding at all. What that costs a steering committee, and the division of labour that fixes it.
A steering committee approves a budget on the strength of a number. That number came out of a formula. The formula was computed by a tool — and if your organisation runs more than one tool, you do not have one number. You have several, and the gap between them does not announce itself.
We found ours by accident, in our own data, while doing something else entirely.
Executive Summary: When Several Tools Hold the Same Number, You Are Deciding on a Range Nobody Has Measured
Conclusion and recommendation. Name one system of record for every number that reaches a decision, net every other implementation against it with fixtures generated from that record — ties included, deliberately — and state which aggregate statistic each report uses. Do that and the disagreements become lookups. Until then, the figure in front of the committee is not a number but a range, and nobody in the room knows how wide it is.
The problem. The same fact is held by a tracker, a spreadsheet, a dashboard, an application, a slide a PMO retyped by hand, and now an AI agent asked to summarise the position. Each holds a fragment; none is authoritative; nothing nets them. A decision taken on unreconciled fragments has left the facts behind, whatever its confidence sounds like.
The analysis. We ran twenty-nine of our own estimate/actual pairs through our own calibration tool. Twenty-eight agreed with the tracker to within 0.011. One diverged by 8.7% — no bug in any implementation, a difference in rounding mode. A second divergence, 16% wide, needs no rounding at all: our estimating bias reads as 1.12× or 1.30× depending on which aggregate you take, and both are correct.
The evaluation. At the scale of one half-day task these are curiosities. In a portfolio roll-up they are the difference between “we over-run by about a tenth” and “by about a third” — two sentences that produce different budgets. And because the arithmetic sits inside a feedback loop, the drift is not reported once and forgotten; it is fed back and re-learnt, so the chain grows more confident as it grows more wrong.
Problems: Your Calculation Chain Has More Than One Implementation, and Nobody Has Netted Them
Almost every organisation computes its important numbers more than once. A figure originates in a spreadsheet formula field, is recomputed by a BI tool for the dashboard, is recomputed again by an application that consumes the same data, and is now increasingly recomputed a fourth time by an AI agent asked to summarise the position. Four implementations of one definition, maintained by different people, in different languages, at different times.
There is usually a fifth, and it is the one nobody counts: the PMO preparing the pack. Figures are lifted out of the tracker into a spreadsheet, rounded to fit a column, summed into a subtotal the source system never computed, and pasted into a slide. That is an implementation too — written in cell references and keystrokes, reviewed by nobody, and re-created from scratch every reporting cycle.
The reason this persists is a category error that is genuinely easy to make: a formula field in a spreadsheet or tracker does not look like an implementation. It looks like the data. Nobody puts it on the list of systems to reconcile, because it does not present itself as a system. We had already learnt this lesson for the Python-to-TypeScript pair and written it into our own engineering standards — and we still missed the tracker, for exactly this reason.
There is a second reason it survives: rounding ties are rare. Feed a hundred realistic values through two implementations that differ only in rounding mode and ninety-nine will agree. A defect that shows up in one case per hundred does not look like a defect. It looks like noise, or like someone mistyping a figure into a slide.
The Intelligence Problem Underneath the Arithmetic
Take a step back from the decimals and this is a data-to-decision problem, which is the PMO’s actual job. Data becomes information when it is placed in context, information becomes knowledge when it is reconciled and understood, and knowledge is what a decision is supposed to rest on. Fragmentation breaks that ladder at the first rung: when several tools each hold a piece of the same fact and no two of them agree exactly, there is no reconciled position to build knowledge from.
What reaches the committee instead is a narrative — internally consistent, confidently delivered, and detached from the facts by an unknown margin. That is not a governance failure anyone can see happening, because the narrative is coherent; coherence is exactly what it has instead of grounding. A decision made on it has left the evidence behind while keeping the vocabulary of evidence.
For a C-suite reader, an executive sponsor or an advising consultant, the exposure does not present as a rounding difference. It presents as a statistical error in the reporting, an AI summary that asserts a precision it never had, and a strategic call made on both. Those are three different incident reports, and all three have the same root: several implementations of one definition and no authority between them.
It is worth being blunt about why estimation is the sorest place for this to happen. Executives have long experience of estimates that are padded and still late — a figure inflated for safety, the work over-running anyway, and the response being more people and more firefighting. Where delivery is contracted out, padding is a rational hedge against risk the supplier carries alone, which is a structural feature of how the work is bought rather than a failing of whoever quoted it; the practical consequence is that quoted effort and eventual effort can differ by a multiple rather than by a margin. Estimates are tied to budget cycles, delivery windows and launch timing, so an inflated one is not a harmless cushion; it moves money and dates. The estimating instrument therefore arrives in the room already carrying the least trust of any number in the pack, and an instrument that is quietly biased is the last thing it can afford.
This has become sharper, not softer, as more of the calculation moves to AI agents. When an agent reads the data, computes a figure and writes the commentary in a single step, the arithmetic is the least-inspected layer in the chain. Reviewers audit the prose, because the prose is what they can read. The number arrives already formatted, already in a sentence, already carrying the authority of having been computed. In the era of auditing what an LLM produced, the arithmetic is where the least scrutiny meets the most trust.
Analysis: The Same Item, Two Authorities, 1.15 and 1.25
We ship a Bayesian estimation-calibration layer, and until recently it had never seen our own data. Its log held zero rows while our tracker held years of estimate/actual pairs. We loaded it — twenty-nine completed pairs, every one read out of the tracker.
The headline result was reassuring:
| Observations | 29 |
| Delay factor (posterior mean) | 0.891 |
| 95% credible interval | 0.836 – 0.945 |
| Confidence | high — well-calibrated |
A delay factor below 1.0 means we over-estimate: work lands faster than we said it would, by about 1.12× per item. Per category:
| Category | n | Delay factor |
|---|---|---|
| content | 3 | 0.994 |
| infra | 6 | 0.978 |
| security | 9 | 0.921 |
| module-dev | 5 | 0.766 |
| ops-housekeeping | 5 | 0.756 |
Then we compared each item’s ratio against the tracker’s own equivalent column. Twenty-eight agreed to within 0.011. One did not.
A Tie, and Two Defensible Ways to Break It
The item had optimistic, most-likely and pessimistic estimates of 0.05, 0.1 and 0.3 sessions. PERT expected duration is (O + 4M + P) / 6, so:
(0.05 + 4(0.1) + 0.3) / 6 = 0.75 / 6 = 0.125 exactly0.125 is a tie: it sits exactly halfway between 0.12 and 0.13, and it is one of the rare decimal values a binary float represents perfectly, so the tie is real rather than an artefact of floating point.
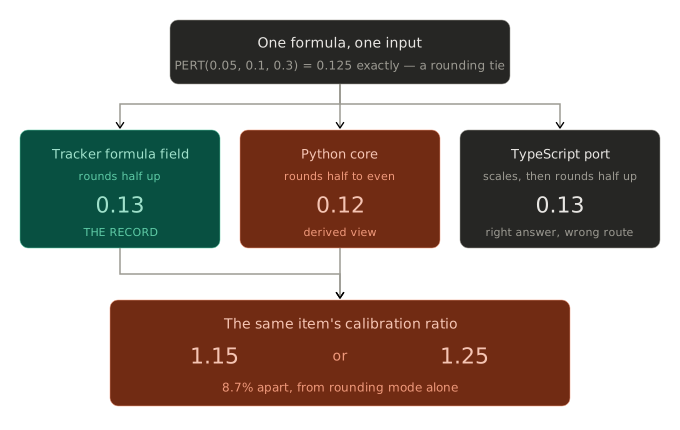
- The tracker rounds half away from zero — the convention most people are taught at school. 0.125 becomes 0.13.
- Python rounds half to even, the IEEE 754 default, chosen because it does not accumulate an upward bias across many roundings. 0.125 becomes 0.12.
- The TypeScript port reaches 0.13, but by a different route: it multiplies by 100, rounds, and divides back. That happens to agree with the tracker here, and it is still wrong, because scaling manufactures ties that the underlying double never had.
The actual duration was 0.15 sessions. So the same item’s calibration ratio is:
0.15 / 0.13 = 1.15 0.15 / 0.12 = 1.258.7% apart, from rounding mode alone — and larger than the rounding itself, because rounding happened before the division rather than after it. One decimal place of disagreement in the denominator became almost a tenth of the answer.
It is worth naming what PERT contributes to this. A three-point estimate is a judgement about a distribution, and (O + 4M + P) / 6 collapses it to a single expected value. Reporting that value to two decimal places states a precision the underlying judgement never had — which is why the second decimal was free to disagree across three tools without anybody noticing that it was carrying weight it could not bear.
Who Found It, and Why Nobody Had
The division of labour matters to how this surfaced. The twenty-nine pairs were not retyped by a person; an agent read them from the tracker, loaded them into the calibration tool, and then compared its own output against the tracker’s equivalent column — which is the step that produced the finding. It found the discrepancy by checking its own work against a second source, not by being clever about arithmetic.
That is also the reason it had gone unfound for so long. Two of the three implementations were never reviewed as code by anybody. A formula field is configured in a browser by whoever built the view; it has no diff, no test and no reviewer, and it can be edited by someone who would never describe themselves as writing software. The same now applies to a growing share of code that an AI agent writes and a human approves in bulk. Low-code configuration and AI-written implementation share one property that matters here: the number of implementations grows faster than the number of things anyone has agreed to review.
The Divergence That Needs No Rounding at All
While reconciling that, a second and larger gap surfaced, and this one is not about arithmetic precision:
- Mean of the per-item ratios: 0.891 — we over-estimate by about 1.12×. Every item counts once.
- Ratio of the sums (16.15 actual against 21.02 estimated): 0.768 — we over-estimate by about 1.30×. Large items dominate.
Both are correct. They answer different questions: “how wrong is a typical estimate?” and “how wrong were we across this body of work?” Nothing marks which one a given report used, and the two produce headline figures 16% apart on identical data. We had previously circulated “about 1.4×” internally, which came from three observations and overstated both.
Evaluation: The Arithmetic Sits Inside a Feedback Loop, So a One-Off Drift Does Not Stay One-Off
It is tempting to file all of this as a rounding detail. The reason not to is structural, and it is visible if you take the layers in turn.
The event is that one calibration ratio disagreed between two systems.
The pattern is that disagreement occurs only on ties, so the chain looks healthy in aggregate and fails on individual items. Twenty-eight of twenty-nine agreeing is not evidence of correctness. It is evidence that the failure mode is rare, which is a different and much less comforting statement.
The structure underneath is three things at once: three implementations of one definition with no fixture netting them against each other; no designated system of record, so there was no rule for which answer wins; and two valid aggregate statistics with no convention about which gets reported.
The mental model at the bottom is the one that generated all three: that a formula is a formula, that rounding is presentation rather than logic, and that a configuration field in a tracker is data rather than code.
What makes this worth a steering committee’s attention rather than an engineer’s is the loop it sits in. An estimate informs a decision. The decision produces an actual. The actual feeds calibration. Calibration adjusts the next estimate. A bias in the arithmetic layer is not a one-time misreport — it is fed back in, and it trains the next estimate. A chain that quietly rounds one way will keep telling you that you are better calibrated than you are, and will keep doing so more confidently as the sample grows.
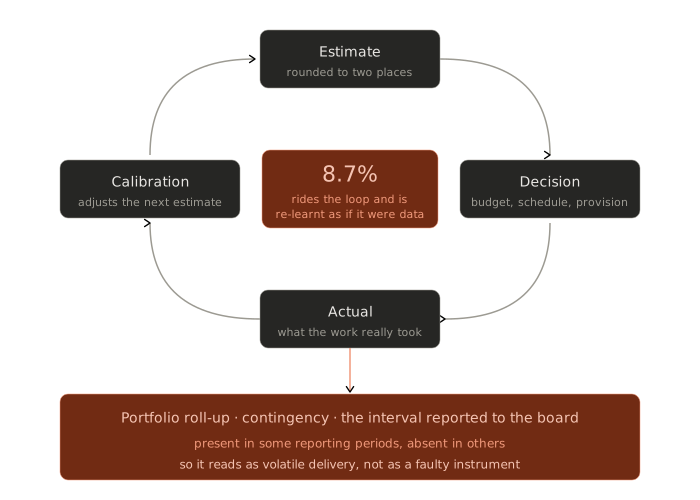
Two things compound in that picture, and they are worth separating. The first is arithmetic: a drift on one item becomes a drift on a subtotal, then on a portfolio roll-up, then on a contingency figure derived from the roll-up. The second is worse, because it is a learning effect rather than an addition. Each turn of the loop treats the drifted figure as an observation, so the instrument is not merely misreporting — it is being trained on its own error, and the credible interval it reports narrows around the wrong value.
That gives an ordering of leverage, weakest to strongest. Correcting the affected number is the weakest possible intervention and buys nothing beyond that number. Adding a regression test is better, but only catches the case you thought of. Designating a system of record is stronger still, because it converts every future disagreement from a debate into a lookup. The strongest is changing the model that says a tracker’s formula field is not an implementation, because that is what kept it off the reconciliation list in the first place.
The risk framing follows directly. An 8.7% drift on a half-day task is noise. The same defect operating on a portfolio roll-up, a contingency calculation or a confidence interval reported to a board is a budget line — and, because the divergence is rare rather than systematic, it will appear in some reporting periods and not others, which reads as volatility in delivery rather than as an instrument fault.
Recommendation: Designate the Record, Net the Implementations Against It, and Say Which Statistic You Mean
Four things, in the order we would do them again.
1. Name the system of record, explicitly. Not the most accurate system, not the newest — the authoritative one. Ours is the tracker: it is where the numbers are entered, reviewed and used to run the work, so it wins ties by definition. Everything else, including our own calculation library, is a derived view. That single sentence resolves the 1.15-versus-1.25 question without anyone needing to argue about rounding standards. In our case the tracker’s 1.15 stands and the tool’s 1.25 is the derived figure.
2. Net the implementations with fixtures generated from the record. Not by reading the two implementations side by side — that method has now failed us twice, because rounding places and rounding modes look alike on the page. Generate cases from the authoritative system, including deliberate ties, and assert the others reproduce them. Ties will not appear in realistic sample data often enough to be caught by accident, so they have to be put there on purpose.
3. State which statistic you mean, every time. Mean-of-ratios and ratio-of-sums are both legitimate and will keep producing different headline numbers forever. Label them in the report rather than reconciling them, because there is nothing to reconcile — they are answers to different questions.
4. Give each layer one job, and put the tests on the boundaries. The division of labour that worked for us:
- The tracker is the record, the reference and the teaching material. Estimates and actuals are entered there and nowhere else. It is deliberately the least clever component in the chain.
- The maths library and its MCP server are the calculation. They hold the formulas and the Bayesian updating, they have no opinion about what the numbers mean, and they can be rebuilt from the record at any time. We proved that property rather than asserting it: the calibration log was reconstructed from an empty database in a single session, entirely from the tracker.
- The agent is the orchestrator and the analyst. It moves data between the two, runs the comparison, and writes up what it found — including, in this case, the finding that its own two sources disagreed.
The boundaries between those three are where the netting belongs, because they are the only places where two independent answers to the same question exist and can be compared.
One caution to carry forward, because the pressure runs the other way. Every integration you add — a sync, a dashboard, an agent given tool access — is another place holding a fragment of the same fact, and it will be introduced as a convenience rather than as an implementation. Autonomous agents make this faster still: they can create a derived figure, act on it and report it without a person seeing the intermediate step. Count implementations, not tools, and require each new one to declare which system of record it defers to before it is allowed to hold a number anybody decides on.
A closing note on the AI-audit question, since it is the same problem wearing different clothes. The reason this defect was findable is that the calculation layer was separable and could be interrogated on its own. Had the agent simply read the tracker and written “we over-estimate by roughly 1.2×”, the sentence would have been approximately true, entirely plausible, and unauditable. When you are checking what an AI produced, ask it for the arithmetic, not the conclusion — the conclusion is the part designed to be easy to agree with.